Irregular Objects Lab

Purpose
To determine an unknown substance using its density.

Materials

  1. Two blocks composed of an unknown substance
  2. Scale
  3. Ruler
  4. Beaker
  5. 150 milliliters of water

Procedure

  1. Make observations about the block and put it in your data table
  2. Put the block on the scale and determine the mass. Put it in your data table
  3. Fill a beaker with water up to 150ml
  4. Put the block gently into the beaker
  5. Determine the amount of water that the block displaced, put it in your data table
  6. Find the width, length, and height of the block in cm
  7. Determine the volume by multiplying the length by the width and the height, put it in your data table
  8. Determine the density by plugging the mass and volume into the following equation: Density = Mass/Volume, put it in your data table
  9. Using the density of the block, determine the substance by comparing the density of the block to the Common Densities table below. The density that has the closest density to your block is probably the substance that the block is made up of.

Common Densities

Material  Density (g/mL) Density (g/ cm^3)
Brass 8.4 8.4
Oak 0.6-0.95 0.6-0.95
Pine  0.35-0.5 0.35-0.5
Rosewood 0.9-1.0 0.9-1.0
Copper 8.86 8.86
Aluminum  2.7 2.7
Acrylic 1.2 1.2
Steel 7.8 7.8
Nylon 0.9 0.9
PVC 1.35 1.35

Data

Block 1

Object Description: Metallic, semi-reflective

Mass: 45g

Volume: 16ml or 15.625cm^3

Density: 2.812 g/ml or 2.8g/cm^3

Substance: Aluminum

Block 2

Object Description: Clear, appears to be acrylic

Mass: 18g

Volume: 16ml or 15.625cm^3

Density: 1.125 g/ml or 1.152 g/cm^3

Substance: Acrylic

Conclusion

In this experiment, we determined the density of an unknown substance and compared its density to a table of common densities in order to identify what the unknown substance is. Block 1 is composed of aluminum since the density of the block was 2.8125 g/ml since the mass of the block was 45 grams and the volume was 16 ml. When looking at the common densities table, the density of aluminum is 2.7 g/ml, which is the substance with the closest density to the block. Block 2 is composed of acrylic since the density of the block was 1.125 g/ml since the mass of the block was 18 grams and the volume was 16 ml. When looking at the common densities table, the density of acrylic is 1.2 g/ml, which is the substance with the closest density to the block. The densities of both blocks can be used to determine it’s composition since density is an intensive property, which means that the property stays constant regardless of the quantity of the substance. For example, the density of 1 gram of aluminum is 2.7 g/ml, and the density of 1,000 grams of aluminum is still 2.7 g/ml, since density is the relationship between the mass and volume of a substance, so it always stays the same.

During this experiment, the volume of the blocks were determined using two methods, by calculating the displacement of the block in water, and by calculating the volume of the block using L•W•H. Errors that could have arose from calculating the displacement of the block in water is not having small enough increments in units on the side of the beaker to accurately determine how much the water was displaced by the block. Errors that could have arisen from calculating the volume of the block using L•W•H is having a ruler that was slightly off, which resulted in incorrect calculations. Improvements to the experimental design that we could have made, was to use a beaker which has really small increments of units on its side so that we can accurately determine how much the water was displaced. Since calculating the displacement of the block in water is more accurate than calculating the volume of the block using L•W•H, we could have stuck to calculating displacement to get a more accurate value for the block’s volume. We can use the findings in this experiment to perform other experiments such as determining the composition of a block which has multiple substances in it.

Deliver: Data

Here is the GitHub link to the final version of the repository: musically.py

Things that work in our program is the gui. The gui allows the user to understand what the program does, and allows them to interact with our program intuitively. This results in the collection of data that we then use to compute a song that the user is most likely to like.

Things that the program could improve upon is the check for bad user input as we currently don’t check for it since we ran out of time. In addition to that, if the user enters in 0 for any of the values, it breaks our algorithm. If the user enters a number that is greater than 10, our program still runs, which it shouldn’t since the max that they could rate an element of a song is 10.

I think the responsibilities that I accomplished successfully is creating tools to help my team stay oriented towards our end goal. I think I fell short on keeping the project on time since we were unable to deliver our product on Friday, June 14 due to running out of time.

I think that keeping the team on task and on time was the most challenging part of my role since I had team members that either only did work during class time and other who did the majority of the work outside of class. Trying to keep these two very different modes of operations were hard since the code was once left on a team members personal machine at home, and we were left without the most current code.

The things that I would add and fix in the program are:

  1. Including checks for bad inputs
  2. A tie-breaking algorithm
  3. Playing the song to the user

Develop: Data

Here is a link to our GitHub repository: musically.py

Somethings that are working well in our program are:

  1. The gui
  2. The collection of data from the user
  3. The creation of and assigning values to a user song list

Some challenges that remain to be solved are:

  1. Ensuring that user input of data in always valid – Kaylee Nieves, Naela Comer
  2. Ensuring that the program only outputs one song – Daniel Germany

Realistically, we will not be able to deliver a program that presents the user with the best song that would match the song that they entered since we ran out of time. We still need to implement some sort of tiebreaker and ensure that the user input is always valid. If we got an extra day, we could potentially deliver a product that we would be proud of and would be able to present the user with the best song that would match the song they entered.Screen Shot 2019-06-15 at 1.16.02 AM.png

Design: Data

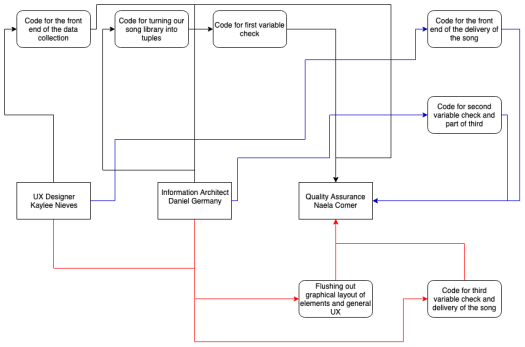
The Golden Owls will first start with creating graphical representations of the program. These graphical representations include flowcharts that show the flow of both the front and back end of the program and graphical layouts. Once these graphical representations are finished, the UX Designer will start coding the front end of the program while the Information Architect will start to work on organizing our song library as tuples and the algorithm to sort our songs. Meanwhile, Quality Assurance will be testing various parts of the program that are completed for any issues.

Blank Diagram.png

While the UX Designer and Quality Assurance are working on the front end of the program for collecting data from the user, the Information Architect is working on storing our song library as tuples, then working on the first variable check. This should be done by Wednesday, June 5. Quality Assurance will then test the front end of the program for collecting data and the first variable check. Meanwhile, the UX Designer is working on the front end of the program when the song gets delivered to the user. This involves the audio player which will play the song and the way the text of the song is displayed. The Information Architect will then work on the second variable check and get started on the third variable check. This should be done by Monday, June 10. Finally, Quality Assurance will test the front end of the program for the delivery of the song and the second variable check. The Information Architect will finish the third variable check and continue on to the delivery of the song to the user. The UX Designer will then be working on ironing out graphical layouts of the front end and making it more user-friendly. This should be done by Thursday, June 13. We will then spend Friday, June 14 as a team to run through the program and ensure that everything works as it should and that we didn’t forget anything in the program.

Wednesday, June 5 – Front end for data collection is finished, Loading of song library into tuples and first variable check is finished

Monday, June 10 – Front end for delivery of the song is finished, Second and part of the third variable check is finished

Thursday, June 13 – Entire program is finished

Friday, June 14 – Entire team testing, Hotfixes


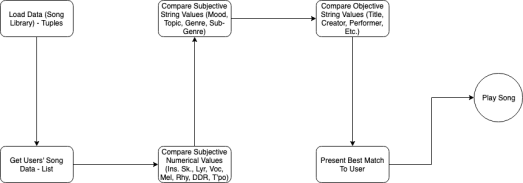
Here is a graphical representation of the workflow:

Workflow.png


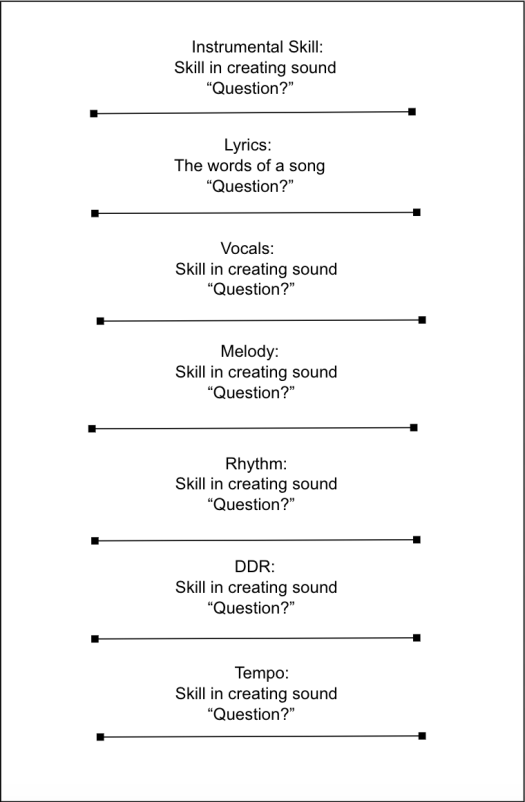
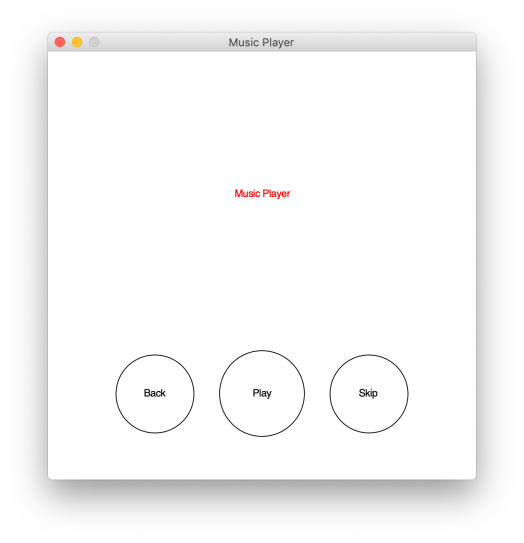
Here are some examples of the front-end of the program:

Screen Shot 2019-06-03 at 1.00.34 PM
Rough layout for the data collection for the user’s song
Screen Shot 2019-06-03 at 1.01.17 PM
Rudimentary audio player created with graphics.py

Here are some examples of the back-end of the program:

Screen Shot 2019-06-03 at 1.01.30 PM
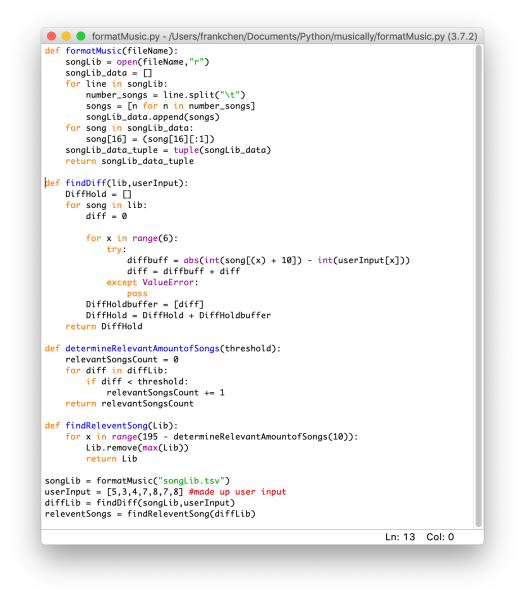
Code to format our song library into tuples
Screen Shot 2019-06-03 at 1.05.29 PM
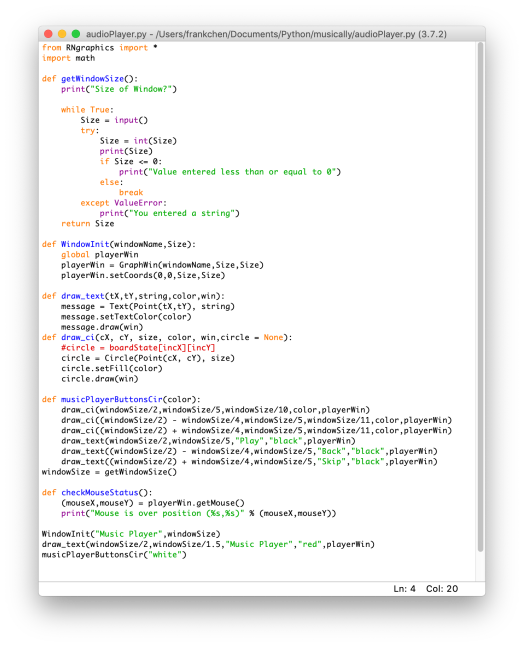
Part of the code to display the audio player
Screen Shot 2019-06-03 at 1.05.36 PM
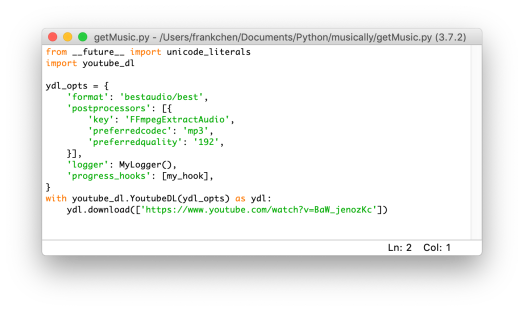
Code to pull the outputted song from youtube


Screen Shot 2019-06-03 at 1.04.56 PM
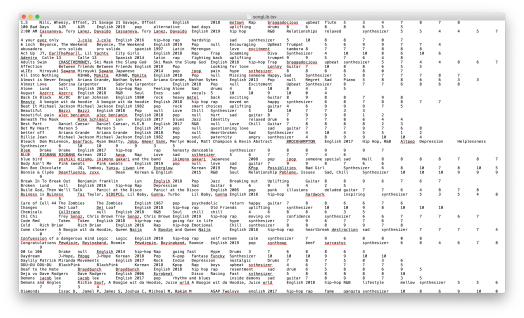
Our song library as a tsv file

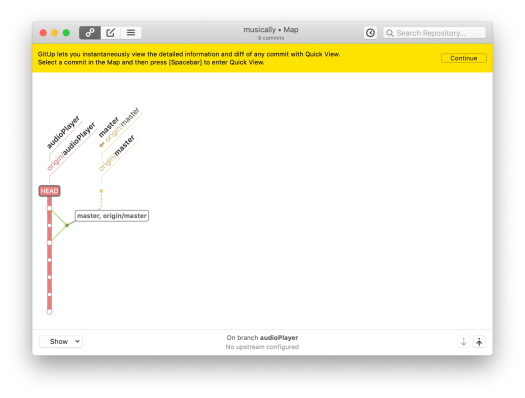
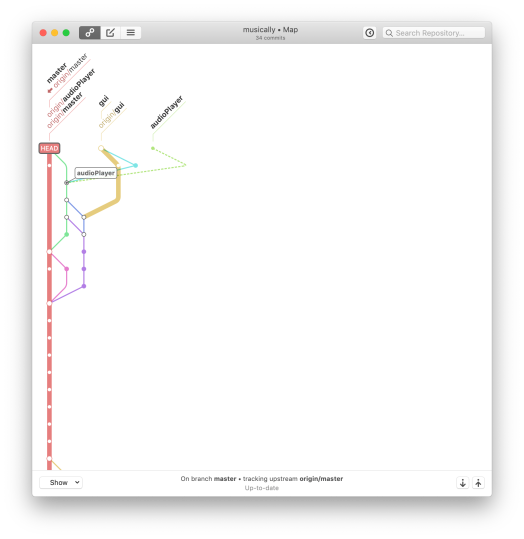
GitUp code tree:

Screen Shot 2019-05-31 at 8.56.13 PM.png

Define: Data

My role in the Golden Owls as the project manager is to oversee the development of our program. This involves meeting with the other members of the team to come up with and execute a plan of action that will point us in the right direction for creating an end product that we can all be proud of. In addition to that, I monitor the workflow of the entire team to ensure that we are constantly on track to completing the project by the given deadline.

The UX Designer on our team, Kaylee Nieves, is in charge of the flow of the front end of the program. She has to ensure that the user has a positive experience when using our program. This involves creating graphics to show the layout of elements on different pages and the flow of the program from one page to another and putting those graphics into practice through coding the actual front end of the program.

The Information Architect on our team, Daniel Germany, is in charge of the organization and usage of data in our program. He has to ensure that our program can efficiently store and use data to give the user an output that meets their expectations. This involves creating graphics to show the flow of the code and data as it gets processed through our algorithm and putting those graphics into practice through coding different elements of the back end of the program such as the algorithm and the creation and use of variables, lists, tuples, and modules.

The Quality Assurance on our team, Naela Comer, is in charge of testing the program. She has to ensure that our program can run without encountering any errors and still deliver the expected output to the user. This involves testing our program and identifying areas of code that are troublesome or could be optimized and working with the other members of the team to ensure that any errors will be fixed before the final product is delivered.

Discover: Data

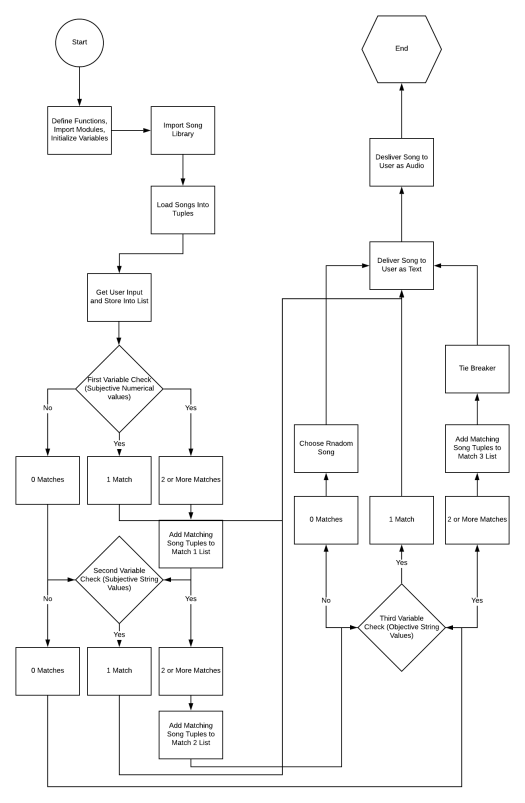
Our program will require the user to answer 18 questions about a song that they like. The program will then put the answers to the questions into a list and compare it to the song library, which will be a collection of tuples. After comparing the user’s song to the song library, we will then output the song to the user in text and play it.

Our program will first need to import our song library as a tsv, which stands for tab separated values. This allows us to use commas to have more than one piece of data for each category. Once our song library is imported, we will then need to make every single individual song into its own tuple, which is basically a collection of multiple pieces of data under the same name that only the programmer can change on the backend of the program. We then put all the tuples of the songs into one big overarching tuple that holds all the songs.

Once we have imported our song library and converted it into a bunch of tuples, we will then need to ask the user a series of questions to gather 18 pieces of data ranging from objective values such as the title of the song to subjective values such as how important the melody is to the song and how much the song makes you want to dance. We will then put the user inputted data into a list, which is a collection of multiple pieces of data under the same name that the program/user can change.

We will then need to enter the user’s song and the song library into an algorithm to calculate a song in our song library that has the highest likelihood that the user will like. Our algorithm will calculate an overall score for the song, placing a heavier emphasis on subjective numerical values such as tempo, melody, vocals, etc, with subjective string values such as the mood, topic, genre, and sub-genre of the song and the objective string values such as the creator and performer having a lesser emphasis. The overall score will then be compared to the overall score of the songs in our song library. The song that is the closest to the user’s song score will then be returned to the user in both text and audio.

For example, if a song has an average of 80 for its subjective numerical values, the user values the subjective string values a 7 out of  a 10 point scale, and the user values the objective string values a 5 our of a 10 point scale, the total average of the song, in this case, would be 66.6. When comparing this overall score to our song library, it will look for a song that is the closest to the overall score of 66.6, and that song will then be returned to the user in text with all its information and in audio, playing the song for the user.

musicallyFlowChart

Members of Golden Owls are:

Frank Chen – Project Manager

Naela Comer – Quality Assurance

Check out their Unit 6: Data category here!

Daniel Germany – Information Architect

Check out their Unit 6: Data category here!

Kaylee Nieves – User Experience

Check out their Unit 6: Data category here!

Climate-Based Clothing Design

Define

How would you describe the climate of your city (see climate zones resource on classroom and match your city to one of the climate zones)?

I would describe the climate of my cities Rome and Hohot as a Mediterranean climate. This means that the area receives enough precipitation to support vegetation and its summers can be very hot, but its winters are mild.

What types of materials are good for this type of climate (see clothing resources on classroom)?

Types of materials that are good for this type of climate are cotton, chambray, and linen. They all provide high amounts of breathability and circulation of air for the hot summers.

Why does your city have the climate it does (Look at your notes from the 5 factors of climate)?

My city has the climate it does since Rome and Hohot are on the windward side of the mountain, so it receives precipitation as the warm air from the ocean blows towards the mountain.

Why is this piece of clothing ideal for your city’s climate (see clothing resources on classroom)?

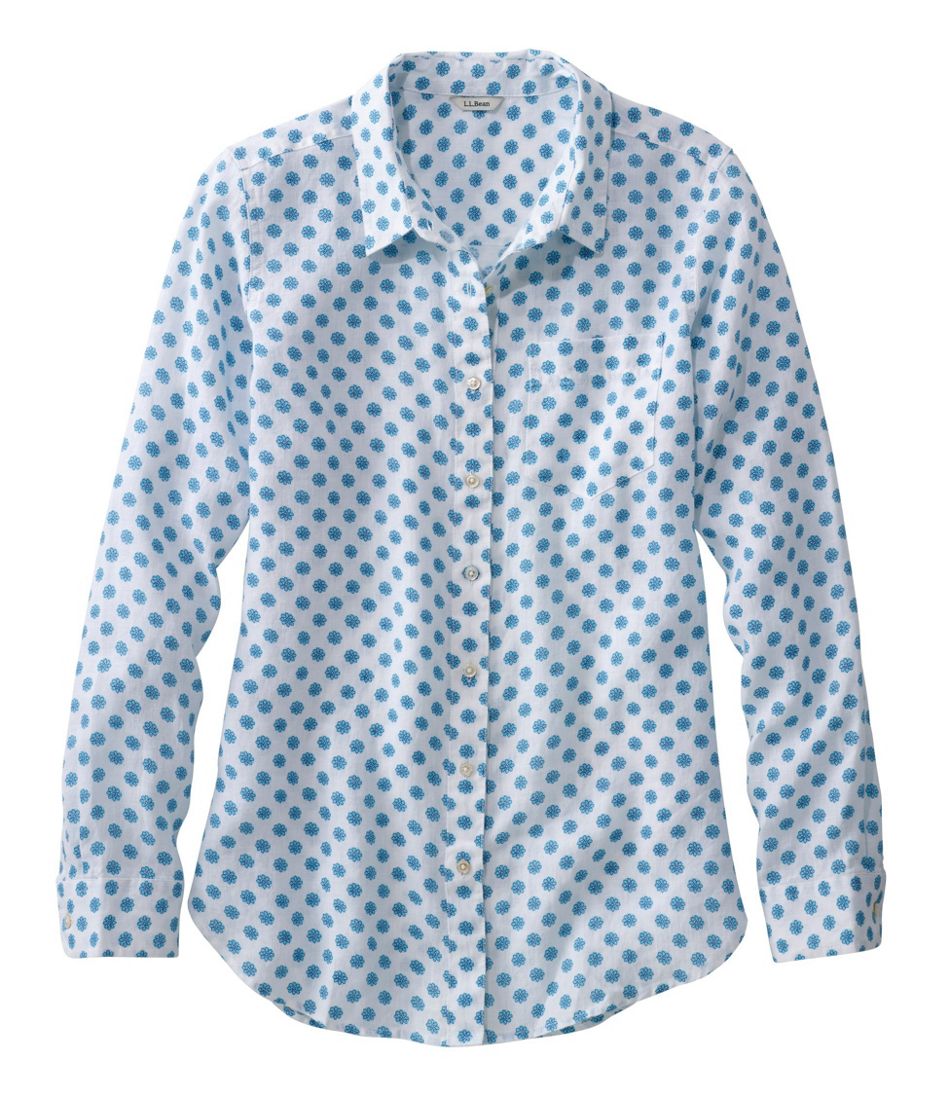
This piece of clothing is ideal for my city’s climate since it can easily be layered with a blazer during the spring or fall and an overcoat during the winter while offering maximum breathability during the summer.

Design:

Either insert a picture of a drawing of your climate or create your design digitally here

Image result for linen shirts

Materials Used:

Chambray


Develop

Will this article of clothing be ideal for the next 5 days? Why or why not?

This article of clothing will be ideal for the next 5 days since the weather in both Rome and Hohhot is pretty warm with temperatures in the 70s and 60s with small amounts of precipitation.

What is causing the weather for the next 5 days?

The increase in wind speed is causing the weather for the next 5 days. As the speed of the wind increases, more water vapor is pushed into the atmosphere, which results in an increased amount of precipitation.

How will climate change cause your article of clothing to change?

Climate change will cause my article of clothing to change by causing it to be layered more often. As climate change worsens, global weather patterns will become more exaggerated and more unpredictable, because of this my article of clothing will start to be layered more often rather than being worn by itself.

Software Careers

Here are 18 positions within the software industry with a description of what each position does:

  1. Hardware Administrator
    • Hardware Administrators, often also called Network or Computer Systems Administrators are responsible for the day-to-day operation of those networks. They organize, install, and support an organization’s computer systems, which includes local area networks (LANs), wide area networks (WANs), network segments, intranets, and other data communication systems.
  2. Developer
    • Software Developers, often also called Developers, Programmers, Coders, or Software Engineers are the creative minds behind computer programs. Software Developers are in charge of analyzing the needs of users and then designs, tests, and develops software to meet those identified needs. In addition to that, Software Developers design each individual piece of an application or system and plan how each individual piece interacts with each other to create a seamless system that takes advantage of each individual piece.
  3. Search Engine Optimizer
    • Search Engine Optimizers, often also called SEO Analysis’s or SEO Specialists, are in charge of increasing the amount of traffic that a website receives in terms of search engine results.
  4. Quality Assurance
    • Quality Assurance, often also called Quality Control, tests out software and attempts to break them. In addition to that, QA diagnoses issues and documents the process that one takes to achieve the specified issue and is sent back to Software Engineers to fix.
  5. Information Architect
    • Information Architects break down the flow of information in a program. Whereas UI/UX Designers design the physical placement and look of where buttons and menus go, Information Architects decides the information that they contain.
  6. Data Analyst
    • Data Analysts translate numbers into coherent reports. Data Analysts looks at vast amounts of data and use that data to come up with conclusions about various things such as sales performances, program efficiency, etc.
  7. Database Administrator
    • Database Administrators set up and maintain servers that house data. Database Administrators also work with SQL to organize that data and make sure that it is easily accessible to Data Analysts.
  8. Sales Engineer
    • Sales Engineers are Software Engineers that specialize in the explanation of code to non-code speaking customers. Sales Engineers are usually the ones that get the call once Sales Representatives gets a question that is technically grounded, and requires a person with a technical background to answer.\
  9. Project Manager
    • Project Managers have the responsibility of the planning, procurement, and execution of a project that has a defined scope, start and finish.
  10. Business Development
    • Those working within Business Development look for ways to develop and implement opportunities for growth both within and outside the organization.
  11. Product Manager
    • Product Managers have the responsibility for the planning, procurement, and execution of a product. Product Managers are also responsible for ensuring that the product stays within the predefined scope of the product and doesn’t get too complex.
  12. UI/UX Designer
    • UI/UX Designers design the look and layout of the frontend side of applications. They are in charge of designing elements that work seamlessly with each other and create scenes that are not only appealing to look at but also functional.
  13. Technical Writer
    • Technical Writers are in charge of writing the documentation that comes along with a program.
  14. Sales Representative
    • Sales Representatives are in charge of creating and maintaining positive relationships with customers.
  15. Technical Support
    • Technical Support is in charge of resolving issues with software that may arise after the product is sold to the customer. If issues that Technical Support cannot resolve pop up, they document that issue and send it higher up the chain for investigation.
  16. Marketing Writer
    • Marketing Writers are in charge of writing the marketing material that gets displayed to the public, whether that be a script to a podcast or a promotional pamphlet.

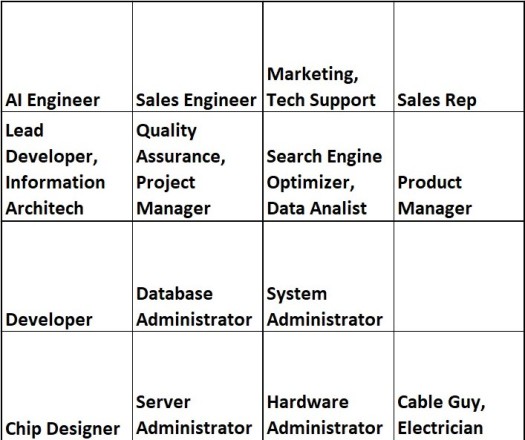
SoftwareCareersScreenshot.jpg

Three positions within the software industry that seems like a match for me are Information Architect, Database Administrator, and Project Manager. I believe that I would be happy as an Information Architect since I’m organized and like to break things down to smaller elements. I believe that I would be happy as a Database Administrator since Database Administrators need to categorize, sort and create solutions to place data into, which is part of breaking things down to smaller elements. I believe that I would be happy as a Project Manager since I like leading projects and managing overseeing the development of projects.

I believe that my best-fit position within the software industry is as an Information Architect since I’m good at breaking down things into small elements, such as classes and subclasses in a program. In addition to that, I’m organized and able to identify what I need to accomplish a task. Finally, I like to look at information and manipulate it into graphics that are presentable and easily understood.

ourGraphics.py

screen-shot-2019-05-03-at-9.11.31-am.png

Use the following link to view remote GitHub repository.

Some issues that we faced when trying to merge branches was forgetting that there were essentially two repositories, one on our local machines and one remote one. We would occasionally locally merge branches but forget to push them up to the remote. In addition to this, the computers in the classroom didn’t have the most updated version of Chrome installed, and this resulted in git not being able to merge our branches.

Screen Shot 2019-05-03 at 9.41.18 AM.png

Astronomy Unit Reflection

I chose Trappist-1 f as the planet we should move to since it is relatively similar to earth. Trappist-1 f has a radius of 1.045 times the radius of the earth and a mass that is 0.68 times the mass of earth. Although Trappist-1 f only has an orbital radius of 0.0096 times the orbital radius of the earth and has an orbital period of 9.2 earth days, this can be taken advantage of as the planet would be tidally locked. This means that on the outer edges of the equator of Trappist-1 f, the climate will be extremely stable.

We will have to leave earth because all life on it is being threatened. Either that be the occurrence of a nuclear war or environmental degradation, humans will be unwillingly forced out of our home planet. While the move to a different planet may be seen as a last ditch effort to save mankind, it is in reality, an effort to preserve the destructive tendencies of humankind.

Our entire way of life will need to be redefined on our new planet. Not only will we need to adapt to new environments, we will also need to adapt to a new way of thinking. Sustainability will have to be an integral part of our life, as the repetition of the actions that occurred on earth will simply yield no result other than the one we would have already experienced once; the uprooting of humankind to a new home.